![]()
Recently we have been reviewing the findings of our data research report and taking a look at some key issues including how people continue to be overwhelmed by organizational change, how analysis of past projects is showing that commitment can be hard to build and sustain and the top 5 change risks that contribute to low commitment on projects. And how a new breed of change management tools can help you navigate all of this.
In this post, we turn our attention to the importance of regular and structured tracking of change management risks to ensure the success of your change programs.
Why tracking change matters
As change management plans are communicated, tested and deployed, new risks will emerge to threaten early commitment - and this makes measuring and tracking people change risks at different stages of a change project crucial to getting your projects over the line successfully.
At the same time, the availability of digital change management tools that enable:
- leaders to be able to bring disparate change data together for them to act in an agile way
- practitioners to access dashboarding capability to allow them to deliver more data insights and progress reports teams and executive stakeholders
- data to be easily compared and benchmarked to help validate quick decisions
also mean you should be building data firmly into your change management strategy.
Regular change management risks tracking, at different stages of a project shows how people commit to change and user adoption levels shift or adjust over time. We have no experience that reaching 100% commitment is possible, but we do know that:
- establishing measurement tools and tracking processes
- and bringing transparency to new or re-occurring people risk dimensions
will improve your change implementation performance.
So what change management risks should you be tracking?
Here are some practical recommendations.
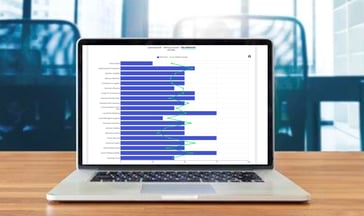
Using change management tools can provide regular “mid-point” tracking, at different stages of a project shows how people commitment and user adoption levels shift. The data below shows the percentage of people, in the Changefirst database, responding to our Initiative Risk Assessment at each major project stage – and how this changes over time.

It tells you about the need to create interest at the beginning of projects but also how - at the end of these projects – people are typically likely to respond less.
So, what is driving this “tail-off” in responses. Well it could be for several reasons including, for example:
- Project success was declared too soon
- People are becoming bored or losing interest in the project goals
- Sponsors are not being persistent enough in pursuing the program goals
We typically recommend change management risk tracking at these stages. However, project sponsors can obviously request more data collection. So, treat this as a minimum requirement only.
If you are in interested in exploring the need for tracking in more detail then download a copy of our Power of Data report 2018 – Using Real-time Data to Drive Decision Making.
About the Initiative Risk Assessment (IRA)
 The data sourced in this blog post was provided by the (IRA) which is just one of 9 proven change assessment tools available via our Roadmap Pro platform.
Used for diagnosis and tracking of people-centred risks in single change initiatives - the IRA is a diagnostic survey tool modeled on the 6 Critical Success Factors (CSFs) for single initiatives. The 6 CSFs are assessed using a total of 20 questions, which relate to 20 specific risk dimensions.
The tool then provides an analysis of risks with very specific actions designed to help mitigate against the risks themselves.
Learn more about the IRA here.
To book a personalized demonstration of Roadmap Pro visit our website – and click on schedule demo.


Leave a comment