By Audra Proctor, Director & Head of Learning, Changefirst
Tweet

With more than 400,000 individual data points from over 26,000 contributors worldwide, all held in our nifty cloud‐based technology, called e-change, we would say we probably have the largest quantitative people change database in the world. After almost 10 years of focused data capture, we believe we can, for the first time, identify and benchmark change performance, to understand what really makes projects successful and what the common mistakes are.
Change practitioners regularly access e-change to benchmark their change performance and underwrite key (Go-No Go) change decisions. In addition, we recently released a Data Report series sharing our own interpretations with project managers and change leaders. However, a strong desire to codify human behaviour during change, coupled with this combination of technology and data, puts us in danger of making very bad decisions far more quickly, and with greater impact than we did in the past.
I'm also reminded of the comfort that this vast quantity of data brings and that logical fallacy that is a potential trap for change agents; leading them to over-rely on numerical information and act on startling data connections, sometimes without testing for face validity; post hoc ergo propter hoc translated "after this, therefore because of this".
It strikes me that to unlock the power of this people-change data, we need to pay as much attention to how we think and the questions we ask, as to how we code and count the numbers. As such I'm encouraged to write a blog that probably asks more question than it answers.
In Report 1 of our series we shared what 5,000+ people (of the total 26,000 contributors to our database), using our Initiative Legacy Assessment diagnostic, told us; 12-18 months after change is supposedly implemented, more than ½ the organisation have Accepted change but are not committed to it. Just 25% of people are Committed and the remaining 21% are still Resisting the change. This is a worrying statistic given that sustained commitment is the known prerequisite for successful implementation and eventual business case achievement.
Download The Power of Data: Report 1
The same contributors also went on to offer some key change legacy variables that still appeared to have a high risk score after the PMO had been wound-up and the project was considered BAU. These include a lack of targeted rewards and recognition, people feeling insufficiently involved, and little or no engagement of informal and political leaders.
So, back to that logical fallacy; if event Y (low sustained commitment) came after event X (issues with rewards, involvement, leadership etc.), then event Y must be caused by event X. Therefore, to improve performance of a new change project I would need to target those change legacy connections to be included and addressed in early planning ... or would I?
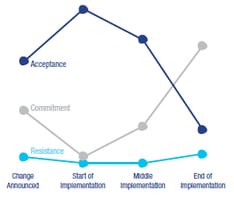
3,500+ people, this time using our Initiative Risk Assessment diagnostic for ongoing tracking against a baseline, reported that over the course of the change process, commitment levels do actually rise.
 Specifically there appears to be energy and optimism, when change is announced, which gives rise to early commitment (at 33%) and less resistance (at 18%); but could this be as a result of early planning to address those 5 key change legacy variables mentioned earlier?
There follows a more conservative period at the start of implementation, probably as more about the change is understood and felt, that is accompanied by a notable drop off in commitment, corresponding to a similar increase in acceptance.
Thereafter, as acceptance falls away steadily (to 56% and then to 27%), commitment increases, by similar amounts (to 28% and then to 54%). During this same period resistance levels seem to be unchanged, so, is it reasonable to assume that people are moving between Acceptance and Commitment?
So, while commitment may be difficult to sustain, do we know what is actually happening near the end of a project that makes acceptance fall and commitment increase, both dramatically?
The same contributors to the Initiative Risk Assessment reported some very stubborn risks that re-occur across the different stages of the change process, yet commitment levels are actually rising. However it’s their reporting of another 5 variables, where very small drops in risk scores, by just a few data points, seem to make a big difference and that might be the hidden tiger which helps us capitalise on a commitment level that is twice the level shown in the Legacy Assessment.
These 5 variables and subsequent risk reductions are:
1. Maintaining focus on the future state/vision, keeping focused on outcomes and embedding new behaviours = risk down by 7 points.
2. Sustained visibility of the solution, case studies and benefits of use, measurement and taking care not to declare victory until the solution is in full use and supporting continuous improvement = risk down by 6 points.
3. Active Sponsor behaviour, effective communication and role modelling of what is expected from others, unblocking issues and keeping change outcomes high on people’s agenda = risk down by 6 points.
4. Ensuring there is local support from line managers to create the conditions for their people to become committed = risk down by 5 points.
5. Providing a personal imperative for individuals and groups to know that they personally need to change = risk down by 4 points.
This is just my interpretation and I'm curious to hear yours. Which variables would you focus on to produce the best results for your projects? What special connections are you making? Where is YOUR hidden tiger?


Leave a comment