We often get asked the best way to report on the progress of change projects and programs. Our quick answer is: use data.
Our slightly longer answer is: use a Change Management approach or Change Management platform that allows you to easily measure and track your key success factors through the lifecycle of your change projects.
Data - A Powerful Tool for Organisational Change
Used correctly data provides you with keen insights into where others have succeeded and failed. It provides a basis for tracking risks and understanding the trends you see in your projects. Plus, data allows you to provide benchmarks and can be used as a basis for business cases.
Whether you are reporting to internal or external stakeholders, to board level, or more broadly across the organisation, it is important to provide visibility and clarity on how your organisational change is progressing.
Data needs to be transparent and trustworthy. Ensuring the right data baselines for your change projects are established, combined with reliable and repeatable mechanisms to collect and track trends in change data, will provide the confidence in dashboard data that your stakeholders expect.
Tracking your change projects
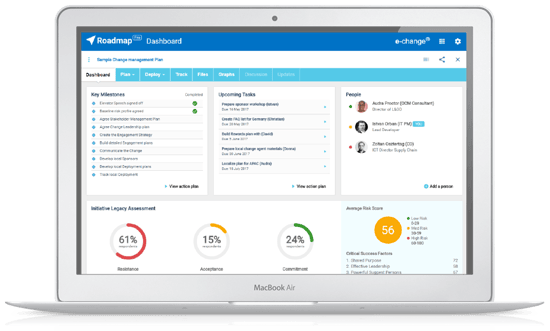
Just as you would expect from your project managers, your change managers should track the progress of change initiatives against key milestones and completion levels. The two key measures we would recommend are employee commitment levels and key people risk scores.
We spoke last week that change management success can be measured in terms of employee commitment levels. Now, we know from our analysis that achieving 100% employee commitment is not a realistic expectation, but our data provides insight into the levels that can be achieved. This provides you with the ability to set achievable targets, and manage the expectations of your key stakeholders.
Reporting on all 20 people risk dimensions can make a change project dashboard too crowded. Instead, pick the top 3-5 risk dimensions for the initiative; and track the trends through the project lifecycle.
These risk dimensions need to reflect the areas which provide the biggest barriers to employee commitment to the change. Don’t forget to review your risk dimensions at mid-points through the project – people risks evolve over a change lifecycle and new barriers to commitment can emerge. Ensure your change projects understand and report on the key issues as they evolve.
Set up the framework for seamless reporting
Preparing to track data is a task that needs to be done upfront, as part of the change program’s planning phase. Early preparation will set the framework for seamless reporting.
Here are some guidelines to get you started on the process.
1. Undertake a legacy assessment & review available baseline data
Use your legacy assessment, plus any data you have collected through tracking prior projects and the baseline data available in e-change, for the next three steps. The baseline data can be analysed generally (as we have done for you in The Power of Data Report) or split by industry or project type.
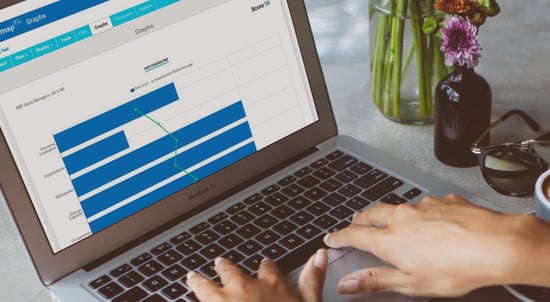
2. Set the expected trend for employee commitment
Use the data from your legacy assessment and/or the baseline data to understand how employee commitment levels can be expected to change over time. Generally, we do not expect to see a linear increase of commitment over time, but instead a dip and then a gradual incline. Not only does this trend provide a useful baseline to track progress through a project, but can be used to manage stakeholders’ expectations.
3. Set a goal of % employee commitment the project aims to achieve.
This is the ultimate target. Then identify the interim targets at specific mid-way points during the lifecycle: e.g. Change announced – Start of Implementation – Middle of Implementation – End of Implementation.
4. Choose the initial top risks to report
Identify the top risks to the change initiative to start reporting on. The baseline and legacy data will be able to give you some understanding of how the risk dimension score may change over time.
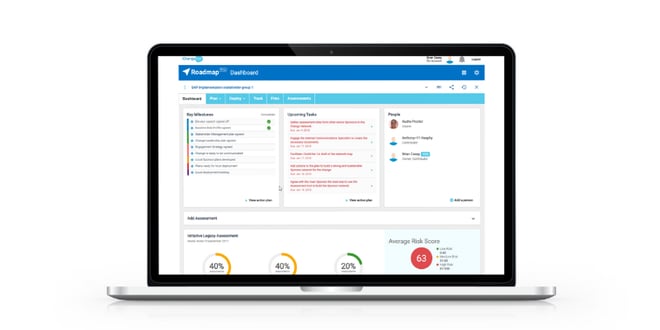
5. Create the dashboard
Choose your preferred choice of dashboard reporting tool and format. 1 screen/1 page/1 whiteboard is the most effective format.
Map the expectations of trends through the project lifecycle (baseline), and identify when measures will be taken: beginning, mid-points, and completion.
Use the same dashboard format for all change projects – this makes it simple for your stakeholders to quickly glean the health of the various projects across your portfolio.
6. Measure, track and report progress
Undertake measurements through risk assessments at the planned mid-way points. Report actuals against mapped expectations.
7. Understand the changes over time, take corrective actions
Deviations from the expectations are not necessarily bad. Understanding where and why the actual measurements deviate from expected trends will help identify if any corrective actions are needed. Don’t forget to ensure the project team reviews all project risks on a regular basis, new risks can emerge at any point.
Learn for the future
The data collected across your portfolio of change projects will become a powerful baseline over time. The more data you collect, the more information you will have which is specific to your organisation.
Tracking commitment levels and people risks through a change project lifecycle provides you with an easy, data-based, indication of the health of your change projects. Using a structured change management methodology, which supports regular change management assessments, ensures the identification, tracking, and reporting of relevant data points is easy, consistent and part of every change project.
If data is key for your organisation you may be interested in our ebook Why People-Centred data is pivotal for successful organisational transformation which is available here.
 |
Get the dashboard view you need on your programsIf you need a data-driven view across your Change projects and programs, then you might want to take a look at Roadmap Pro. You can learn more and schedule a no-obligation demo here.
|


Leave a comment